 It is coming up to the ten year anniversary since David Sullivan and David Gold bought into West Ham in January 2010.
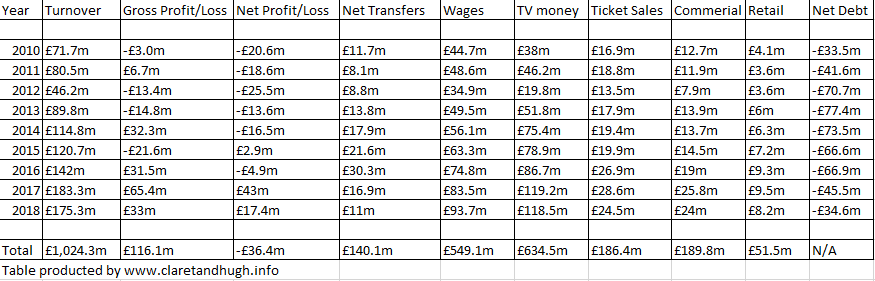
Today Claret and Hugh look at some of the key financial metrics for eight of the nine years of West Ham accounts that have been published to date.
It shows over one billion of turnover between 2010-2018 with £116m of gross profit before transfers, when you factor in transfers the club made a £36m loss over the eight years. Wages have more than doubles in eight years from nearly £45m in 2010 to £nearly £94m in 2018! The biggest change in fortunes is the TV money more than tripling from £38m in 2010 to a peak of £119m in 2017. Ticket sales have risen from nearly £17m in 2010 to a peak of over £28m in 2017. Commercial sales including sponsorship and partnership deals have doubled from nearly £13m to £26m in 2017 while retail sales in the club shop and online have more then doubled from just over £4m to over £9m in 2017.
Net debt looks at the amount owed by when cash in the bank and amount owed to the club are factored in.
Net transfers look at the sums listed in the company accounts as real player trading amount netted out as inbound versus outbound.
Wow! We spend circa 11% less on wages in 2019 as compared to 2010?
ACCA accountant here.
Those figures are intersting to read but not the fait accompli profit / loss figures that would be presented to companies house. Where’s the balance sheet etc? 😀